Oh man! We are finally at part three! The part in which I attempt incorporating two-D space into our diagram:
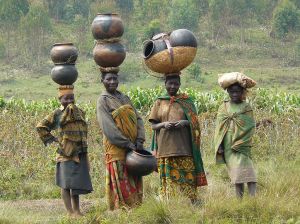
Right, so as we turn our car around and head back up the road, we notice an intriguing turnoff in the Congolese rainforest: a tribe of the shortest people in the world, the Pygmies. According to Wikipedia:
A pygmy is a member of an ethnic group whose average height is unusually short; anthropologists define pygmy as a member of any group where adult men are on average less than 150 cm (4 feet 11 inches) tall.[1] A member of a slightly taller group is termed “pygmoid“.[2]
The term is most associated with peoples of Central Africa, such as the Aka, Efé and Mbuti.[3] If the term pygmy is defined as a group’s men having an average height below 1.55 meters (5 feet 1 inch), then there are also pygmies in Australia, Thailand, Malaysia, the Andaman Islands,[4] Indonesia, the Philippines, Papua New Guinea, Bolivia, and Brazil,[5] including some Negritos of Southeast Asia.

Basically, whenever humans live in tropical rainforests, there’s a good chance they’ll get shorter. (Rainforests also produce pygmy elephants.) Maybe it’s because short people can move more easily through the dense forest, or an adaptation to low levels of iodine, sunlight, or other nutrients–I don’t really know.
Wikipedia estimates that there are between 250,000 and 600,000 pygmies living in the Congo rainforest:
Genetically, the pygmies are extremely divergent from all other human populations, suggesting they have an ancient indigenous lineage. Their uniparental markers represent the most ancient divergent ones right after those typically found in Khoisan peoples. African pygmy populations possess high levels of genetic diversity,[10] recent advances in genetics shed some light on the origins of the various pygmy groups. …
“We studied the branching history of Pygmy hunter–gatherers and agricultural populations from Africa and estimated separation times and gene flow between these populations. The model identified included the early divergence of the ancestors of Pygmy hunter–gatherers and farming populations ~60,000 years ago, followed by a split of the Pygmies’ ancestors into the Western and Eastern Pygmy groups ~20,000 years ago.”
But I recall–was it WestHunt?–objecting that the authors of this paper used a too-fast estimation of genetic mutation rates. Oh here it is:
There are a couple of recent papers on introgression from some quite divergent archaic population into Pygmies ( this also looks to be the case with Bushmen). Among other things, one of those papers discussed the time of the split between African farmers (Bantu) and Pygmies, as determined from whole-genome analysis and the mutation rate. They preferred to use the once-fashionable rate of 2.5 x 10⁻⁸ per-site per-generation (based on nothing), instead of the new pedigree-based estimate of about 1.2 x 10⁻⁸ (based on sequencing parents and child: new stuff in the kid is mutation). The old fast rate indicates that the split between Neanderthals and modern humans is much more recent than the age of early Neanderthal-looking skeletons, while the new slow rate fits the fossil record – so what’s to like about the fast rate? Thing is, using the slow rate, the split time between Pygmies and Bantu is ~300k years ago – long before any archaeological sign of behavioral modernity (however you define it) and well before the first known fossils of AMH (although that shouldn’t bother anyone, considering the raggedness of the fossil record).

Let’s split the difference and say that one way or another, Pygmies split off from their hunter-gatherer neighbors and became isolated in the rainforest quite a while ago.
Before we drive on, I’d like to pause and note that I’m not entirely comfortable with using the way Pygmies are sometimes used in racial discussions. Yes, they are short, but they otherwise look a lot like everyone else in the area. Pygmies go to school, often speak multiple languages, live in cities, work at real jobs, read books, operate businesses, drive cars, fall in love, get married, build houses, etc. For more on Pygmies see my review of Isaac Bacirongo’s memoir Still a Pygmy (Isaac is a Pygmy man who speaks, IIRC, 5 languagues, attended highschool, and owned/ran successful pharmacies in two different cities in the DRC before the army burned them down during a civil war.)
Now I admit that Isaac is just one guy and I don’t know what the rest of the Pygmies are like.

But let’s hop back in our car, for at the other end of this road we have not a small town of isolated forest-dwellers, but a large group we have so far neglected: the Native Americans.
The indigenous peoples of North and South America today number about 60 million people, plus some quantity of mixed-race people (mestizos.) In some areas these mestizos are majority European by ancestry; in others they are majority Indian; studies in Mexico, for example, estimate that 80-93% of the population is Mestizo, with Indian ancestry averaging between 31% and 66% in different regions. The people of El Salvador are about 86% mestizo; Chileans are about 40% Indian and 60% Europeans; Columbia is about 49% mestizo; etc.
Unfortunately, Wikipedia doesn’t list the total number of mestizos, and I don’t have time to calculate it, but I will note that the total population of both continents, including Canada and the USA, is about 1 billion people.

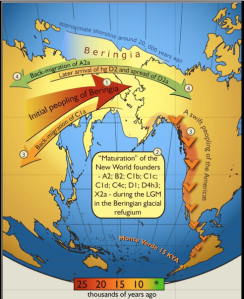
We’re not sure exactly when (or how) the Indians got here, but it looks like they arrived around 10-20,000 years ago across the then-Bering Landbridge. (I think we should also keep in mind the possibility that they could have built boats.) According to Wikipedia:
Scientific evidence links indigenous Americans to Asian peoples, specifically Siberian populations, such as the Ket, Selkup, Chukchi and Koryak peoples. Indigenous peoples of the Americas have been linked to North Asian populations by the distribution of blood types, and in genetic composition as reflected by molecular data, such as DNA.[192] There is general agreement among anthropologists that the source populations for the migration into the Americas originated from an area somewhere east of the Yenisei River. The common occurrence of the mtDNA Haplogroups A, B, C, and D among eastern Asian and Native American populations has long been recognized.[193] As a whole, the greatest frequency of the four Native American associated haplogroups occurs in the Altai–Baikal region of southern Siberia.[194] Some subclades of C and D closer to the Native American subclades occur among Mongolian, Amur, Japanese, Korean, and Ainu populations.[193][195]
Genetic studies of mitochondrial DNA (mtDNA) of Amerindians and some Siberian and Central Asian peoples also revealed that the gene pool of the Turkic-speaking peoples of Siberia such as Altaians, Khakas, Shors and Soyots, living between the Altai and Lake Baikal along the Sayan mountains, are genetically close to Amerindians.[citation needed] This view is shared by other researchers who argue that “the ancestors of the American Indians were the first to separate from the great Asian population in the Middle Paleolithic.”[196][197] 2012 research found evidence for a recent common ancestry between Native Americans and indigenous Altaians based on mitochondrial DNA and Y-Chromosome analysis.[198] The paternal lineages of Altaians mostly belong to the subclades of haplogroup P-M45 (xR1a 38-93%;[199][200][201] xQ1a 4-32%[199][200]).

These ancient Siberians also had some “European” DNA, as do modern Siberians, but they are most closely related to their neighbors to the south, throughout the rest of Asia. Native American DNA is super fascinating, but we don’t have time to get into it all. On the grand scale, Native Americans are genetically Asians, separated from the rest of the clade by (probably) a mere 13-20,000 years. (Somewhat coincidentally, the Dire wolf, Smilodon, giant beaver, ground sloth, giant Columbian mammoth (Mammuthus columbi), woolly mammoth, mastodons, giant short-faced bear, American cheetah, scimitar cats (Homotherium), American camels, American horses, and American lions all went extinct in North America around 12,000 years ago.)
On the grand scale of human history, (200,000 years, more or less,) 13-20,000 years is not very long, and the Native Americans have not diverged too much, physically, from their cousins in Asia. The G-allele mutation of the EDAR gene arose about 30,000 years ago somewhere in east Asia and gives both modern Asians and Native Americans (but not Europeans and Africans) their characteristic hair and skin tone. While Native Americans are clearly physically, culturally, and geographically distinct from other Asians, (just as Europeans and south-Asian Indians are distinct from each other,) they are genetically close enough that they unquestionably clade together in the greater racial schema.

As I’ve said before, my diagram is just one way to represent one aspect of the genetic (and physical) distances between people.
Here is another diagram, not mine, which tells the same story in a different way (though it estimates a much lower genetic distance between Bushmen and Bantus than I’d expect. Oh well. different studies get different results; that’s why replication and meta-analysis are super important):
The Melanesians of Papua New Guinea and Australia are in pink (there are some mixed Melanesian / Polynesian populations in the world, but our road trip skipped them.) Their nearest relatives are other south Asians and Polynesians, but those same south Asians are themselves more closely related to Europeans than Australians. Diagrammed like this, it’d be understandable to break off south Asians into one race and put Caucasians, Native Americans, and East Asians into a single race. And I suppose you could, if you wanted to and could get everyone else to start using your categories. Race is biologically real and quite obvious at the macro scale, but a few small groups like Aborigines and Bushmen introduce existential uncertainty that intellectuals can quibble over.I don’t think it would be terribly useful rearrangement, though, for all of the reasons discussed over the past three posts in this series.
Well, that’s the end of our big road trip! I hope you’ve enjoyed it, and that it’s cleared up that nagging question people seem to have: How can Nigerians be more closely related to Europeans than some other Africans? Have a great day, and enjoy the drive home.

[…] Source: Evolutionist X […]
LikeLike